numpy.random.RandomState.power
method
- random.RandomState.power(a, size=None)
Draws samples in [0, 1] from a power distribution with positive exponent a - 1.
Also known as the power function distribution.
Note
New code should use the
powermethod of adefault_rng()instance instead; please see the Quick Start.- Parameters
- afloat or array_like of floats
Parameter of the distribution. Must be non-negative.
- sizeint or tuple of ints, optional
Output shape. If the given shape is, e.g.,
(m, n, k), thenm * n * ksamples are drawn. If size isNone(default), a single value is returned ifais a scalar. Otherwise,np.array(a).sizesamples are drawn.
- Returns
- outndarray or scalar
Drawn samples from the parameterized power distribution.
- Raises
- ValueError
If a <= 0.
See also
Generator.powerwhich should be used for new code.
Notes
The probability density function is
\[P(x; a) = ax^{a-1}, 0 \le x \le 1, a>0.\]The power function distribution is just the inverse of the Pareto distribution. It may also be seen as a special case of the Beta distribution.
It is used, for example, in modeling the over-reporting of insurance claims.
References
- 1
Christian Kleiber, Samuel Kotz, “Statistical size distributions in economics and actuarial sciences”, Wiley, 2003.
- 2
Heckert, N. A. and Filliben, James J. “NIST Handbook 148: Dataplot Reference Manual, Volume 2: Let Subcommands and Library Functions”, National Institute of Standards and Technology Handbook Series, June 2003. https://www.itl.nist.gov/div898/software/dataplot/refman2/auxillar/powpdf.pdf
Examples
Draw samples from the distribution:
>>> a = 5. # shape
>>> samples = 1000
>>> s = np.random.power(a, samples)
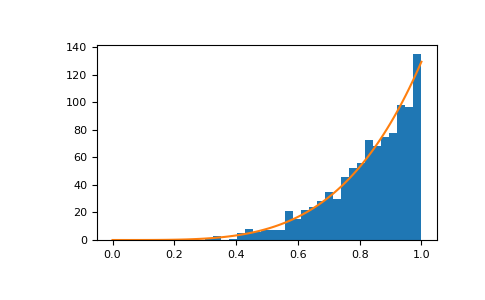
Display the histogram of the samples, along with the probability density function:
>>> import matplotlib.pyplot as plt
>>> count, bins, ignored = plt.hist(s, bins=30)
>>> x = np.linspace(0, 1, 100)
>>> y = a*x**(a-1.)
>>> normed_y = samples*np.diff(bins)[0]*y
>>> plt.plot(x, normed_y)
>>> plt.show()
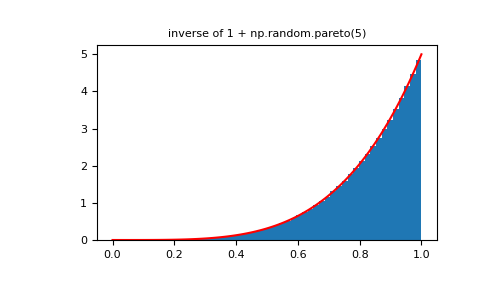
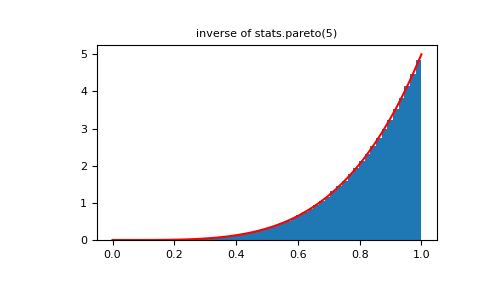
Compare the power function distribution to the inverse of the Pareto.
>>> from scipy import stats
>>> rvs = np.random.power(5, 1000000)
>>> rvsp = np.random.pareto(5, 1000000)
>>> xx = np.linspace(0,1,100)
>>> powpdf = stats.powerlaw.pdf(xx,5)
>>> plt.figure()
>>> plt.hist(rvs, bins=50, density=True)
>>> plt.plot(xx,powpdf,'r-')
>>> plt.title('np.random.power(5)')
>>> plt.figure()
>>> plt.hist(1./(1.+rvsp), bins=50, density=True)
>>> plt.plot(xx,powpdf,'r-')
>>> plt.title('inverse of 1 + np.random.pareto(5)')
>>> plt.figure()
>>> plt.hist(1./(1.+rvsp), bins=50, density=True)
>>> plt.plot(xx,powpdf,'r-')
>>> plt.title('inverse of stats.pareto(5)')