numpy.exp
-
numpy.exp(x, /, out=None, *, where=True, casting='same_kind', order='K', dtype=None, subok=True[, signature, extobj]) = <ufunc 'exp'>¶ Calculate the exponential of all elements in the input array.
Parameters: x : array_like
Input values.
out : ndarray, None, or tuple of ndarray and None, optional
A location into which the result is stored. If provided, it must have a shape that the inputs broadcast to. If not provided or None, a freshly-allocated array is returned. A tuple (possible only as a keyword argument) must have length equal to the number of outputs.
where : array_like, optional
Values of True indicate to calculate the ufunc at that position, values of False indicate to leave the value in the output alone.
**kwargs
For other keyword-only arguments, see the ufunc docs.
Returns: out : ndarray
Output array, element-wise exponential of x.
See also
Notes
The irrational number
eis also known as Euler’s number. It is approximately 2.718281, and is the base of the natural logarithm,ln(this means that, if ,
then
,
then  . For real input,
 exp(x)is always positive.For complex arguments,
x = a + ib, we can write . The first term,
  , is already
known (it is the real argument, described above). The second term,
, is already
known (it is the real argument, described above). The second term,
 , is
, is  , a function with
magnitude 1 and a periodic phase.
, a function with
magnitude 1 and a periodic phase.References
[R18] Wikipedia, “Exponential function”, http://en.wikipedia.org/wiki/Exponential_function [R19] M. Abramovitz and I. A. Stegun, “Handbook of Mathematical Functions with Formulas, Graphs, and Mathematical Tables,” Dover, 1964, p. 69, http://www.math.sfu.ca/~cbm/aands/page_69.htm Examples
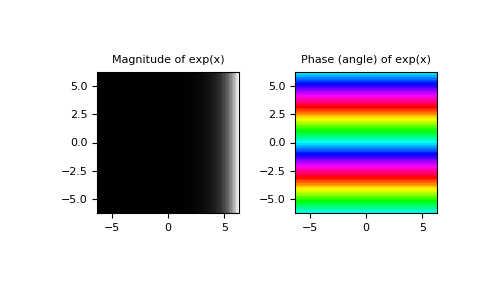
Plot the magnitude and phase of
exp(x)in the complex plane:>>> import matplotlib.pyplot as plt
>>> x = np.linspace(-2*np.pi, 2*np.pi, 100)
>>> xx = x + 1j * x[:, np.newaxis] # a + ib over complex plane
>>> out = np.exp(xx)
>>> plt.subplot(121)
>>> plt.imshow(np.abs(out),
...            extent=[-2*np.pi, 2*np.pi, -2*np.pi, 2*np.pi], cmap='gray')
>>> plt.title('Magnitude of exp(x)')
>>> plt.subplot(122)
>>> plt.imshow(np.angle(out),
...            extent=[-2*np.pi, 2*np.pi, -2*np.pi, 2*np.pi], cmap='hsv')
>>> plt.title('Phase (angle) of exp(x)')
>>> plt.show()