numpy.sin
-
numpy.sin(x, /, out=None, *, where=True, casting='same_kind', order='K', dtype=None, subok=True[, signature, extobj]) = <ufunc 'sin'>¶ Trigonometric sine, element-wise.
Parameters: x : array_like
Angle, in radians (
rad equals 360 degrees).
out : ndarray, None, or tuple of ndarray and None, optional
A location into which the result is stored. If provided, it must have a shape that the inputs broadcast to. If not provided or None, a freshly-allocated array is returned. A tuple (possible only as a keyword argument) must have length equal to the number of outputs.
where : array_like, optional
Values of True indicate to calculate the ufunc at that position, values of False indicate to leave the value in the output alone.
**kwargs
For other keyword-only arguments, see the ufunc docs.
Returns: y : array_like
The sine of each element of x.
Notes
The sine is one of the fundamental functions of trigonometry (the mathematical study of triangles). Consider a circle of radius 1 centered on the origin. A ray comes in from the
axis, makes an angle at the origin (measured counter-clockwise from that axis), and departs from the origin. The
coordinate of the outgoing ray’s intersection with the unit circle is the sine of that angle. It ranges from -1 for
to +1 for
The function has zeroes where the angle is a multiple of
. Sines of angles between
and
are negative. The numerous properties of the sine and related functions are included in any standard trigonometry text.
Examples
Print sine of one angle:
>>> np.sin(np.pi/2.)
1.0
Print sines of an array of angles given in degrees:
>>> np.sin(np.array((0., 30., 45., 60., 90.)) * np.pi / 180. )
array([ 0.        ,  0.5       ,  0.70710678,  0.8660254 ,  1.        ])
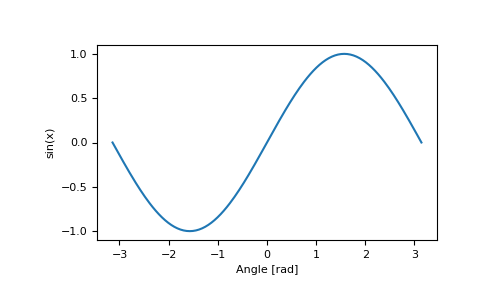
Plot the sine function:
>>> import matplotlib.pylab as plt
>>> x = np.linspace(-np.pi, np.pi, 201)
>>> plt.plot(x, np.sin(x))
>>> plt.xlabel('Angle [rad]')
>>> plt.ylabel('sin(x)')
>>> plt.axis('tight')
>>> plt.show()
