Contributions
Like many open source projects, NumPy largely relies on community contributions for maintenance and improvements. One of the objectives of this survey was to learn more about NumPy users’ experiences and motivations as contributors to NumPy and other open source projects.
# Load data related to open-source contributions *other* than NumPy

fname = "data/2021/numpy_survey_results.tsv"
column_names = [
    'contributed', 'projects', 'projects_other', 'contr_type',
    'contr_type_other', 'regular', 'how_got_started', 'how_got_started_other',
    'interested', 'limitations'
]
nonnumpy_contributions_dtype = np.dtype({
    "names": column_names,
    "formats": ['<U1024'] * len(column_names),
})

ossdata = np.loadtxt(
    fname, delimiter='\t', skiprows=3, dtype=nonnumpy_contributions_dtype,
    usecols=range(33, 44), comments=None, encoding='UTF-16'
)
# Load data related to NumPy contributions
column_names = [
    'contributed', 'contr_type', 'contr_type_other', 'regular',
    'how_got_started', 'how_got_started_other', 'motivations',
    'motivations_other', 'continue', 'limitations', 'limitations_other',
    'interested', 'interests', 'interests_other'
]

numpy_contributions_dtype = np.dtype({
    "names": column_names,
    "formats": ['<U1024'] * len(column_names),
})

npdata = np.loadtxt(
    fname, delimiter='\t', skiprows=3, dtype=numpy_contributions_dtype,
    usecols=range(44, 59), comments=None, encoding='UTF-16'
)
assert npdata.shape[0] == ossdata.shape[0]  # Sanity check on data
# Selection criteria for subsequent analysis
oss_contributors_mask = ossdata['contributed'] == 'Yes'
np_contributors_mask = npdata['contributed'] == 'Yes'
# Compute some basic parameters on OSS/np-specific contributions
num_respondents = npdata.shape[0]
num_oss_contributors = oss_contributors_mask.sum()
num_np_contributors = np_contributors_mask.sum()
num_both_contributors = np.sum(oss_contributors_mask & np_contributors_mask)
# Compute fraction of regular contributors.
num_oss_regular = np.sum(ossdata['regular'][oss_contributors_mask] == 'Yes')
num_np_regular = np.sum(npdata['regular'][np_contributors_mask] == 'Yes')
# Links for report
glue(
    '2021_oss_contributors',
    gluval(num_oss_contributors, num_respondents),
    display=False
)
glue(
    '2021_np_contributors',
    gluval(num_np_contributors, num_respondents),
    display=False
)
glue(
    '2021_numpy_and_oss_contributors',
    gluval(num_both_contributors, num_np_contributors),
    display=False
)
glue(
    '2021_oss_regulars',
    gluval(num_oss_regular, num_oss_contributors),
    display=False
)
glue(
    '2021_np_regulars',
    gluval(num_np_regular, num_np_contributors),
    display=False
)
NumPy & OSS Contributors
Of the 522 survey participants, 197 (38%) have contributed to at least one open source software project, while 46 (9%) have contributed to NumPy specifically. 68 (35%) of OSS contributors are currently1 regular contributors to at least one OSS project, while 15 (33%) of the NumPy contributors contribute to NumPy regularly. Reflecting its central position in the scientific Python ecosystem, 41 (89%) of NumPy contributors reported contributing to other OSS projects as well.
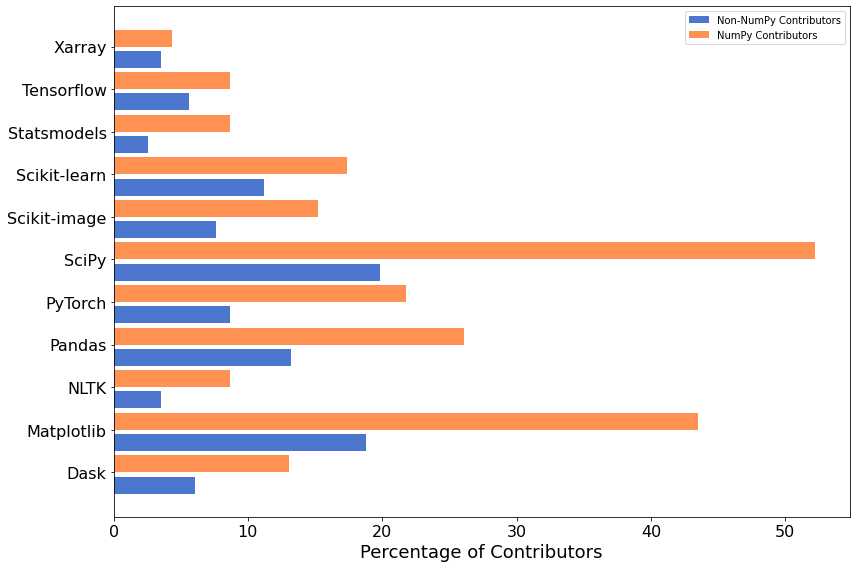
OSS Contributions
The following figure illustrates shows what fraction of contributors are working on various popular scientific Python projects.
# Remove less-popular projects
projects_to_drop = (
    'Gensim', 'spaCy', '', 'CuPy', 'PyMC3',
    'Other (please specify - use commas to separate multiple entries)'
)

fig, ax = plt.subplots(figsize=(12, 8))
for (start_ind, mask, label) in zip(
    (0, 1),
    (oss_contributors_mask, np_contributors_mask),
    ('Non-NumPy Contributors', 'NumPy Contributors')
):
    project_data = flatten(ossdata['projects'][mask])
    labels, cnts = np.unique(project_data, return_counts=True)
    # Projects to drop from all datasets
    for proj in projects_to_drop:
        drop = (labels != proj)
        labels, cnts = labels[drop], cnts[drop]
    # Plot
    ax.barh(
        np.arange(start_ind, 2 * len(labels), 2),
        100 * cnts / mask.sum(),
        align='edge',
        label=label,
    )
ax.set_yticks(np.arange(start_ind, 2 * len(labels), 2))
ax.set_yticklabels(labels)
ax.set_xlabel('Percentage of Contributors')
ax.legend()
fig.tight_layout()
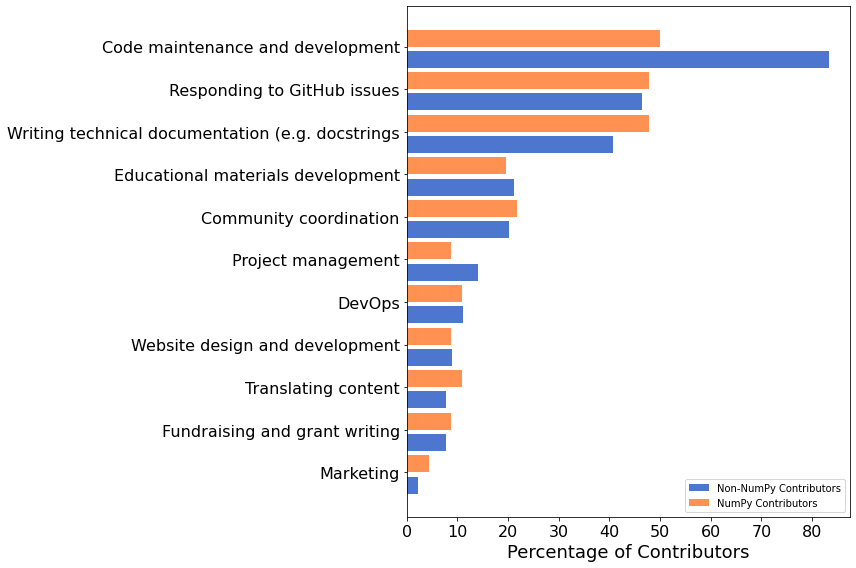
Types of Contributions
We also asked in what ways people are contributing to open-source software projects. 50% of respondents who have contributed to NumPy have contributed to the source code and 48% to the documentation. While 76% of respondents who contribute to other OSS projects have contributed to code, only 37% have pitched in to help with documentation.
fig, ax = plt.subplots(figsize=(12, 8))

# Sort order for categories - computed in loop and kept consistent for both datasets
I = None

for start_ind, (data, mask, label, key) in enumerate(zip(
    (ossdata, npdata),
    (oss_contributors_mask, np_contributors_mask),
    ('Non-NumPy Contributors', 'NumPy Contributors'),
    ('oss', 'np'),
)):
    how_data = data['contr_type'][mask]
    # Remove non-responses
    how_data = how_data[how_data != '']
    data = flatten(how_data)
    # Remove "Other" category
    data = np.asarray(data)
    data = data[data != 'Other (please specify)']
    labels, cnts = np.unique(data, return_counts=True)
    # Ignore duplicate labels from bad split
    labels, cnts = labels[2:], cnts[2:]
    # Apply category ordering
    I = np.argsort(cnts) if I is None else I
    labels, cnts = labels[I], cnts[I]

    # Plot
    ax.barh(
        np.arange(start_ind, 2 * len(labels), 2),
        100 * cnts / len(how_data),
        align='edge',
        label=label,
    )

    # Highlight code and docs results for Q1 and Q2
    code_contr = cnts[labels == 'Code maintenance and development'][0]
    doc_contr = cnts[labels == 'Writing technical documentation (e.g. docstrings'][0]
    glue(
        f'2021_pct_contrib_{key}_code',
        f"{100 * code_contr / mask.sum():2.0f}%",
        display=False,
    )
    glue(
        f'2021_pct_contrib_{key}_docs',
        f"{100 * doc_contr / mask.sum():2.0f}%",
        display=False,
    )

ax.set_yticks(np.arange(start_ind, 2 * len(labels), 2))
ax.set_yticklabels(labels)
ax.set_xlabel('Percentage of Contributors')
ax.legend(loc=4)
fig.tight_layout()
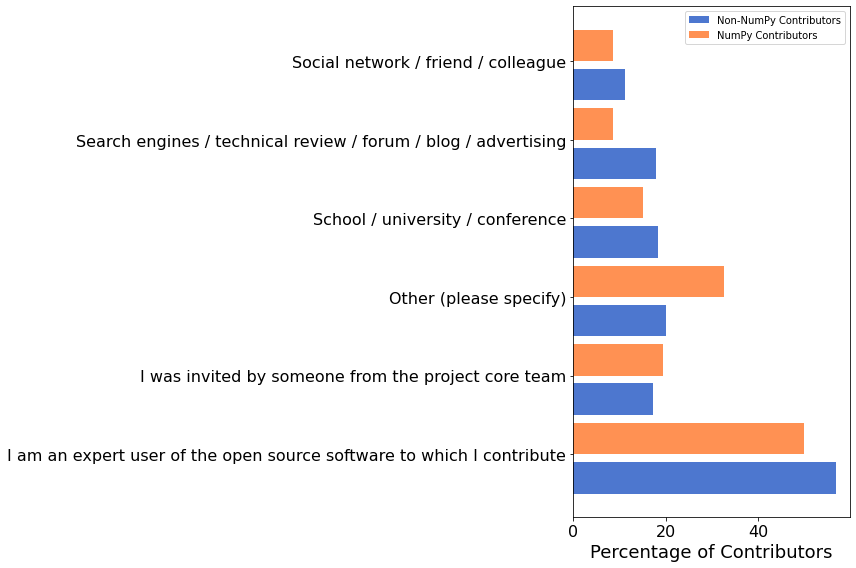
How Did Contributors Get Their Start?
We also asked how contributors got started working on the OSS packages that they contribute to:
fig, ax = plt.subplots(figsize=(12, 8))
for start_ind, (data, mask, label) in enumerate(zip(
    (ossdata, npdata),
    (oss_contributors_mask, np_contributors_mask),
    ('Non-NumPy Contributors', 'NumPy Contributors')
)):
    how_data = data['how_got_started'][mask]
    # Remove non-responses
    how_data = how_data[how_data != '']
    data = flatten(how_data)
    labels, cnts = np.unique(data, return_counts=True)
    # Plot
    ax.barh(
        np.arange(start_ind, 2 * len(labels), 2),
        100 * cnts / len(how_data),
        align='edge',
        label=label,
    )
ax.set_yticks(np.arange(start_ind, 2 * len(labels), 2))
ax.set_yticklabels(labels)
ax.set_xlabel('Percentage of Contributors')
ax.legend()
fig.tight_layout()
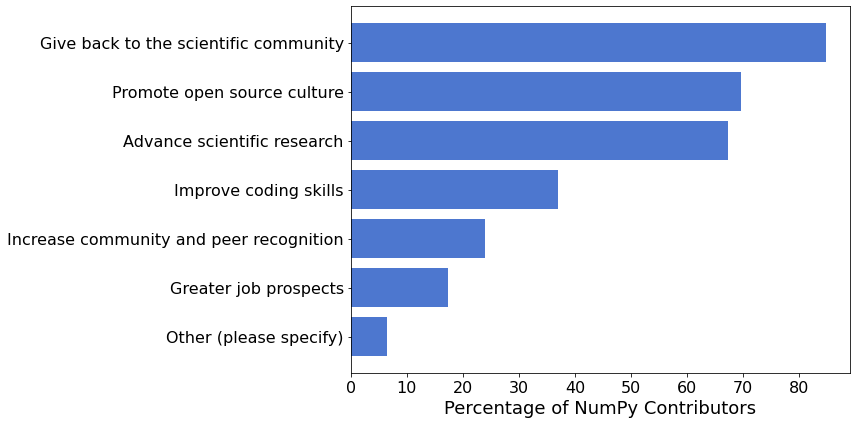
Motivations
Advance scientific research, Promote open source culture, and Give back to the scientific community are the top three reasons for the respondents to contribute to NumPy.
# NumPy data only, no need to apply np/oss masks
motivations = npdata['motivations'][npdata['motivations'] != '']
labels, cnts = np.unique(flatten(motivations), return_counts=True)
I = np.argsort(cnts)
labels, cnts = labels[I], cnts[I]

fig, ax = plt.subplots(figsize=(12, 6))
ax.barh(np.arange(len(labels)), 100 * cnts / len(motivations))
ax.set_yticks(np.arange(len(labels)))
ax.set_yticklabels(labels)
ax.set_xlabel('Percentage of NumPy Contributors')
fig.tight_layout()

# Highlight top 3
glue('2021_top_3_motivations', f"{labels[-3]}, {labels[-2]}, and {labels[-1]}", display=False)
Retention
Finally, we asked NumPy contributors whether they plan to continue to contribute to NumPy. 15 (100%) of survey participants who identified themselves as regular NumPy contributors plan to continue contributing. Of the 31 NumPy contributors who did not consider themselves regular contributors, 90% plan to continue contributing.
np_regular_mask = npdata['regular'] == 'Yes'
regular_continue = npdata['continue'][np_regular_mask] == 'Yes'
glue(
    '2021_regular_continue_pct',
    gluval(regular_continue.sum(), np_regular_mask.sum()),
    display=False
)
non_regular_contributor_mask = (np_contributors_mask) & (~np_regular_mask)
glue(
    '2021_num_nonregular_np_contributors',
    non_regular_contributor_mask.sum(),
    display=False
)
num_nonregular_continue = np.sum(
    npdata['continue'][non_regular_contributor_mask] == 'Yes'
)
glue(
    '2021_become_regular_pct',
    f'{100 * num_nonregular_continue / non_regular_contributor_mask.sum():1.0f}%',
    display=False
)
Users Who Haven’t (Yet) Contributed
We also wanted to get the perspective of NumPy (and other OSS) users who have not directly contributed to projects — is there generally interest in doing so? What are the biggest stumbling blocks for users who want to contribute back? Of the 522 survey respondents, 197 (38%) report never having contributed to an OSS project and 328 (63%) report never having contributed to NumPy specifically.
num_oss_non_contributors = np.sum(ossdata['contributed'] == 'No')
num_np_non_contributors = np.sum(npdata['contributed'] == 'No')
glue(
    '2021_oss_non_contributors',
    gluval(num_oss_non_contributors, num_respondents),
    display=False
)
glue(
    '2021_np_non_contributors',
    gluval(num_np_non_contributors, num_respondents),
    display=False
)
Interest in Contributing
We asked these respondents whether they were interested in contributing to the OSS packages that they use. 157 (80%) said they were interested in contributing to OSS generally, and 196 (60%) to NumPy specifically.
oss_interested_mask = (ossdata['contributed'] == 'No') & (ossdata['interested'] == 'Yes')
np_interested_mask = (npdata['contributed'] == 'No') & (npdata['interested'] == 'Yes')
glue(
    '2021_oss_interested',
    gluval(oss_interested_mask.sum(), num_oss_non_contributors),
    display=False
)
glue(
    '2021_np_interested',
    gluval(np_interested_mask.sum(), num_np_non_contributors),
    display=False
)
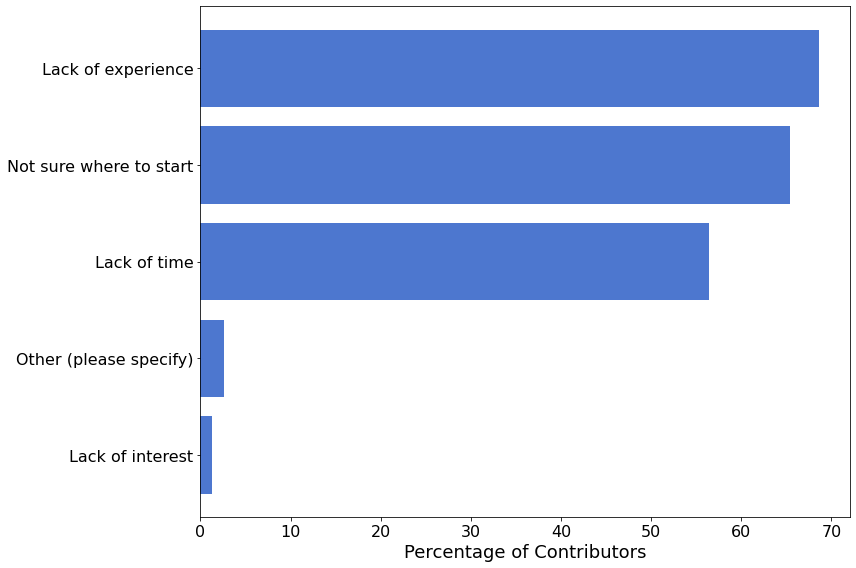
Contribution Blockers
We also asked respondents who expressed interest in contributing about the biggest blockers that prevent them from doing so.
fig, ax = plt.subplots(figsize=(12, 8))
limitations = ossdata['limitations'][oss_interested_mask]
# Remove non-responses
limitations = limitations[limitations != '']
data = flatten(limitations)
labels, cnts = np.unique(data, return_counts=True)
I = np.argsort(cnts)
labels, cnts = labels[I], cnts[I]
# Plot
ax.barh(np.arange(len(labels)), 100 * cnts / len(limitations))
ax.set_yticks(np.arange(len(labels)))
ax.set_yticklabels(labels)
ax.set_xlabel('Percentage of Contributors')
fig.tight_layout()
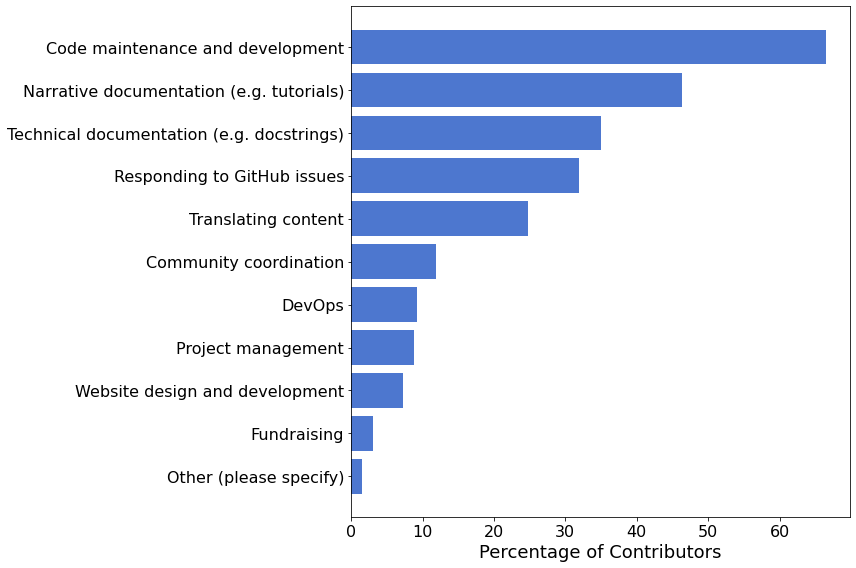
Interests of Potential Contributors
Of the respondents who expressed interest in contributing to NumPy, most (66%) were interested in contributing to the source code. The next most popular category was contributing to the documentation, with 113 (58%) respondents expressing an interest. 45 (23%) people were interested in contributing to both narrative documentation (e.g. tutorials) and technical documentation (e.g. reference guides), while 45 (23%) were interested only in narrative documentation, and 23 (12%) only in technical documentation.
interests = npdata['interests'][np_interested_mask]
interests = interests[interests != '']
data = flatten(interests)
labels, cnts = np.unique(data, return_counts=True)

# NOTE: The labels need a bit of munging here due to the results of the splitting.
# The first two labels are copies of the "Technical documentation" category, thus
# are ignored. The labels corresponding to documentation are also shortened.
labels, cnts = labels[2:], cnts[2:]
labels[3] = 'Narrative documentation (e.g. tutorials)'
labels[-1] = 'Technical documentation (e.g. docstrings)'
I = np.argsort(cnts)
labels, cnts = labels[I], cnts[I]


fig, ax = plt.subplots(figsize=(12, 8))
ax.barh(np.arange(len(labels)), 100 * cnts / len(interests))
ax.set_yticks(np.arange(len(labels)))
ax.set_yticklabels(labels)
ax.set_xlabel('Percentage of Contributors')
fig.tight_layout()

# Highlight top categories
glue('2021_pct_want_contrib_code', f"{100 * cnts[-1] / interests.shape[0]:2.0f}%", display=False)

# Analyze documentation categories based on individual responses
narr_doc_text = "Developing educational content & narrative documentation (e.g. tutorials)"
tech_doc_text = "Writing technical documentation (e.g. docstrings, user guide, reference guide)"
tech_doc_respondents_mask = np.array(
    [tech_doc_text in response for response in interests], dtype=bool
)
narr_doc_respondents_mask = np.array(
    [narr_doc_text in response for response in interests], dtype=bool
)
num_both = np.sum(
    tech_doc_respondents_mask & narr_doc_respondents_mask
)
num_either = np.sum(
    tech_doc_respondents_mask | narr_doc_respondents_mask
)
num_narr_only = np.sum(
    narr_doc_respondents_mask & ~tech_doc_respondents_mask
)
num_tech_only = np.sum(
    tech_doc_respondents_mask & ~narr_doc_respondents_mask
)

glue(
    '2021_interested_in_both_doc_types',
    gluval(num_both, interests.shape[0]),
    display=False,
)
glue(
    '2021_interested_in_either_doc_type',
    gluval(num_either, interests.shape[0]),
    display=False,
)
glue(
    '2021_interested_in_narr_doc_only',
    gluval(num_narr_only, interests.shape[0]),
    display=False,
)
glue(
    '2021_interested_in_tech_doc_only',
    gluval(num_tech_only, interests.shape[0]),
    display=False,
)
- 1
i.e. regularly contributing at the time of the survey. This does not include contributors who have contributed regularly to projects in the past.