numpy.unwrap#
- numpy.unwrap(p, discont=None, axis=-1, *, period=6.283185307179586)[source]#
Unwrap by taking the complement of large deltas with respect to the period.
This unwraps a signal p by changing elements which have an absolute difference from their predecessor of more than
max(discont, period/2)to their period-complementary values.For the default case where period is \(2\pi\) and discont is \(\pi\), this unwraps a radian phase p such that adjacent differences are never greater than \(\pi\) by adding \(2k\pi\) for some integer \(k\).
- Parameters:
- parray_like
Input array.
- discontfloat, optional
Maximum discontinuity between values, default is
period/2. Values belowperiod/2are treated as if they wereperiod/2. To have an effect different from the default, discont should be larger thanperiod/2.- axisint, optional
Axis along which unwrap will operate, default is the last axis.
- periodfloat or int, optional
Size of the range over which the input wraps. By default, it is
2 pi.Added in version 1.21.0.
- Returns:
- outndarray
Output array. Its dtype is
numpy.result_type(p, period). In particular an integer array unwrapped with an integer period keeps its integer dtype, while any float period (including the default2 pi) produces a floating-point result.
Notes
If the discontinuity in p is smaller than
period/2, but larger than discont, no unwrapping is done because taking the complement would only make the discontinuity larger.Examples
>>> import numpy as np
>>> phase = np.linspace(0, np.pi, num=5)
>>> phase[3:] += np.pi
>>> phase
array([ 0.        ,  0.78539816,  1.57079633,  5.49778714,  6.28318531]) # may vary
>>> np.unwrap(phase)
array([ 0.        ,  0.78539816,  1.57079633, -0.78539816,  0.        ]) # may vary
>>> np.unwrap([0, 1, 2, -1, 0], period=4)
array([0, 1, 2, 3, 4])
>>> np.unwrap([ 1, 2, 3, 4, 5, 6, 1, 2, 3], period=6)
array([1, 2, 3, 4, 5, 6, 7, 8, 9])
>>> np.unwrap([2, 3, 4, 5, 2, 3, 4, 5], period=4)
array([2, 3, 4, 5, 6, 7, 8, 9])
>>> phase_deg = np.mod(np.linspace(0 ,720, 19), 360) - 180
>>> np.unwrap(phase_deg, period=360)
array([-180., -140., -100.,  -60.,  -20.,   20.,   60.,  100.,  140.,
        180.,  220.,  260.,  300.,  340.,  380.,  420.,  460.,  500.,
        540.])
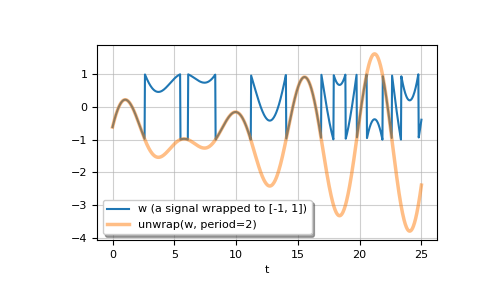
This example plots the unwrapping of the wrapped input signal w. First generate w, then apply
unwrapto get u.>>> t = np.linspace(0, 25, 801) >>> w = np.mod(1.5 * np.sin(1.1 * t + 0.26) * (1 - t / 6 + (t / 23) ** 3), 2.0) - 1 >>> u = np.unwrap(w, period=2.0)
Plot w and u.
>>> import matplotlib.pyplot as plt
>>> plt.plot(t, w, label='w (a signal wrapped to [-1, 1])')
>>> plt.plot(t, u, linewidth=2.5, alpha=0.5, label='unwrap(w, period=2)')
>>> plt.xlabel('t')
>>> plt.grid(alpha=0.6)
>>> plt.legend(framealpha=1, shadow=True)
>>> plt.show()