numpy.random.poisson
- random.poisson(lam=1.0, size=None)
Draw samples from a Poisson distribution.
The Poisson distribution is the limit of the binomial distribution for large N.
Note
New code should use the
poissonmethod of adefault_rng()instance instead; please see the Quick Start.- Parameters
- lamfloat or array_like of floats
Expected number of events occurring in a fixed-time interval, must be >= 0. A sequence must be broadcastable over the requested size.
- sizeint or tuple of ints, optional
Output shape. If the given shape is, e.g.,
(m, n, k), thenm * n * ksamples are drawn. If size isNone(default), a single value is returned iflamis a scalar. Otherwise,np.array(lam).sizesamples are drawn.
- Returns
- outndarray or scalar
Drawn samples from the parameterized Poisson distribution.
See also
Generator.poissonwhich should be used for new code.
Notes
The Poisson distribution
\[f(k; \lambda)=\frac{\lambda^k e^{-\lambda}}{k!}\]For events with an expected separation \(\lambda\) the Poisson distribution \(f(k; \lambda)\) describes the probability of \(k\) events occurring within the observed interval \(\lambda\).
Because the output is limited to the range of the C int64 type, a ValueError is raised when lam is within 10 sigma of the maximum representable value.
References
- 1
Weisstein, Eric W. “Poisson Distribution.” From MathWorld–A Wolfram Web Resource. http://mathworld.wolfram.com/PoissonDistribution.html
- 2
Wikipedia, “Poisson distribution”, https://en.wikipedia.org/wiki/Poisson_distribution
Examples
Draw samples from the distribution:
>>> import numpy as np
>>> s = np.random.poisson(5, 10000)
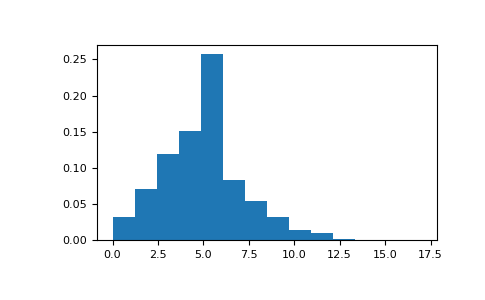
Display histogram of the sample:
>>> import matplotlib.pyplot as plt
>>> count, bins, ignored = plt.hist(s, 14, density=True)
>>> plt.show()
Draw each 100 values for lambda 100 and 500:
>>> s = np.random.poisson(lam=(100., 500.), size=(100, 2))