numpy.random.Generator.noncentral_f#
method
- random.Generator.noncentral_f(dfnum, dfden, nonc, size=None)#
Draw samples from the noncentral F distribution.
Samples are drawn from an F distribution with specified parameters, dfnum (degrees of freedom in numerator) and dfden (degrees of freedom in denominator), where both parameters > 1. nonc is the non-centrality parameter.
- Parameters:
- dfnumfloat or array_like of floats
Numerator degrees of freedom, must be > 0.
- dfdenfloat or array_like of floats
Denominator degrees of freedom, must be > 0.
- noncfloat or array_like of floats
Non-centrality parameter, the sum of the squares of the numerator means, must be >= 0.
- sizeint or tuple of ints, optional
Output shape. If the given shape is, e.g.,
(m, n, k), thenm * n * ksamples are drawn. If size isNone(default), a single value is returned ifdfnum,dfden, andnoncare all scalars. Otherwise,np.broadcast(dfnum, dfden, nonc).sizesamples are drawn.
- Returns:
- outndarray or scalar
Drawn samples from the parameterized noncentral Fisher distribution.
Notes
When calculating the power of an experiment (power = probability of rejecting the null hypothesis when a specific alternative is true) the non-central F statistic becomes important. When the null hypothesis is true, the F statistic follows a central F distribution. When the null hypothesis is not true, then it follows a non-central F statistic.
References
[1]Weisstein, Eric W. “Noncentral F-Distribution.” From MathWorld–A Wolfram Web Resource. https://mathworld.wolfram.com/NoncentralF-Distribution.html
[2]Wikipedia, “Noncentral F-distribution”, https://en.wikipedia.org/wiki/Noncentral_F-distribution
Examples
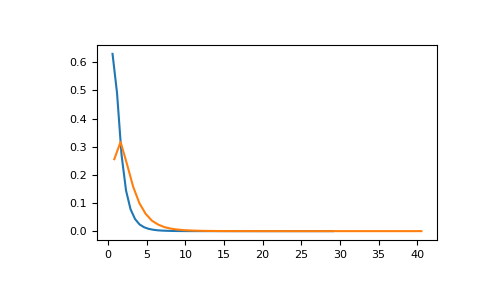
In a study, testing for a specific alternative to the null hypothesis requires use of the Noncentral F distribution. We need to calculate the area in the tail of the distribution that exceeds the value of the F distribution for the null hypothesis. We’ll plot the two probability distributions for comparison.
>>> rng = np.random.default_rng()
>>> dfnum = 3 # between group deg of freedom
>>> dfden = 20 # within groups degrees of freedom
>>> nonc = 3.0
>>> nc_vals = rng.noncentral_f(dfnum, dfden, nonc, 1000000)
>>> NF = np.histogram(nc_vals, bins=50, density=True)
>>> c_vals = rng.f(dfnum, dfden, 1000000)
>>> F = np.histogram(c_vals, bins=50, density=True)
>>> import matplotlib.pyplot as plt
>>> plt.plot(F[1][1:], F[0])
>>> plt.plot(NF[1][1:], NF[0])
>>> plt.show()