numpy.random.Generator.pareto#
method
- random.Generator.pareto(a, size=None)#
Draw samples from a Pareto II (AKA Lomax) distribution with specified shape.
- Parameters:
- afloat or array_like of floats
Shape of the distribution. Must be positive.
- sizeint or tuple of ints, optional
Output shape. If the given shape is, e.g.,
(m, n, k), thenm * n * ksamples are drawn. If size isNone(default), a single value is returned ifais a scalar. Otherwise,np.array(a).sizesamples are drawn.
- Returns:
- outndarray or scalar
Drawn samples from the Pareto II distribution.
See also
scipy.stats.paretoPareto I distribution
scipy.stats.lomaxLomax (Pareto II) distribution
scipy.stats.genparetoGeneralized Pareto distribution
Notes
The probability density for the Pareto II distribution is
\[p(x) = \frac{a}{(x+1)^{a+1}} , x \ge 0\]where \(a > 0\) is the shape.
The Pareto II distribution is a shifted and scaled version of the Pareto I distribution, which can be found in
scipy.stats.pareto.References
[1]Francis Hunt and Paul Johnson, On the Pareto Distribution of Sourceforge projects.
[2]Pareto, V. (1896). Course of Political Economy. Lausanne.
[3]Reiss, R.D., Thomas, M.(2001), Statistical Analysis of Extreme Values, Birkhauser Verlag, Basel, pp 23-30.
[4]Wikipedia, “Pareto distribution”, https://en.wikipedia.org/wiki/Pareto_distribution
Examples
Draw samples from the distribution:
>>> a = 3.
>>> rng = np.random.default_rng()
>>> s = rng.pareto(a, 10000)
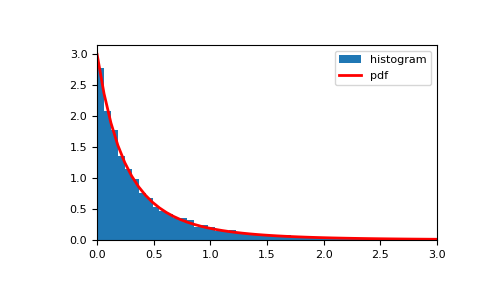
Display the histogram of the samples, along with the probability density function:
>>> import matplotlib.pyplot as plt
>>> x = np.linspace(0, 3, 50)
>>> pdf = a / (x+1)**(a+1)
>>> plt.hist(s, bins=x, density=True, label='histogram')
>>> plt.plot(x, pdf, linewidth=2, color='r', label='pdf')
>>> plt.xlim(x.min(), x.max())
>>> plt.legend()
>>> plt.show()