numpy.random.Generator.weibull#
method
- random.Generator.weibull(a, size=None)#
Draw samples from a Weibull distribution.
Draw samples from a 1-parameter Weibull distribution with the given shape parameter a.
\[X = (-ln(U))^{1/a}\]Here, U is drawn from the uniform distribution over (0,1].
The more common 2-parameter Weibull, including a scale parameter \(\lambda\) is just \(X = \lambda(-ln(U))^{1/a}\).
- Parameters:
- afloat or array_like of floats
Shape parameter of the distribution. Must be nonnegative.
- sizeint or tuple of ints, optional
Output shape. If the given shape is, e.g.,
(m, n, k), thenm * n * ksamples are drawn. If size isNone(default), a single value is returned ifais a scalar. Otherwise,np.array(a).sizesamples are drawn.
- Returns:
- outndarray or scalar
Drawn samples from the parameterized Weibull distribution.
Notes
The Weibull (or Type III asymptotic extreme value distribution for smallest values, SEV Type III, or Rosin-Rammler distribution) is one of a class of Generalized Extreme Value (GEV) distributions used in modeling extreme value problems. This class includes the Gumbel and Frechet distributions.
The probability density for the Weibull distribution is
\[p(x) = \frac{a} {\lambda}(\frac{x}{\lambda})^{a-1}e^{-(x/\lambda)^a},\]where \(a\) is the shape and \(\lambda\) the scale.
The function has its peak (the mode) at \(\lambda(\frac{a-1}{a})^{1/a}\).
When
a = 1, the Weibull distribution reduces to the exponential distribution.References
[1]Waloddi Weibull, Royal Technical University, Stockholm, 1939 “A Statistical Theory Of The Strength Of Materials”, Ingeniorsvetenskapsakademiens Handlingar Nr 151, 1939, Generalstabens Litografiska Anstalts Forlag, Stockholm.
[2]Waloddi Weibull, “A Statistical Distribution Function of Wide Applicability”, Journal Of Applied Mechanics ASME Paper 1951.
[3]Wikipedia, “Weibull distribution”, https://en.wikipedia.org/wiki/Weibull_distribution
Examples
Draw samples from the distribution:
>>> rng = np.random.default_rng()
>>> a = 5. # shape
>>> s = rng.weibull(a, 1000)
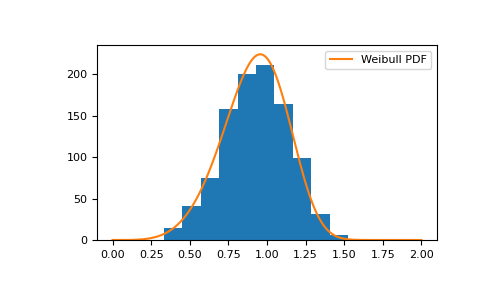
Display the histogram of the samples, along with the probability density function:
>>> import matplotlib.pyplot as plt
>>> def weibull(x, n, a):
...     return (a / n) * (x / n)**(a - 1) * np.exp(-(x / n)**a)
>>> count, bins, _ = plt.hist(rng.weibull(5., 1000))
>>> x = np.linspace(0, 2, 1000)
>>> bin_spacing = np.mean(np.diff(bins))
>>> plt.plot(x, weibull(x, 1., 5.) * bin_spacing * s.size, label='Weibull PDF')
>>> plt.legend()
>>> plt.show()