Contributions
# Load data related to open-source contributions *other* than NumPy

fname = "data/2020/numpy_survey_results.tsv"
column_names = [
    'contributed', 'projects', 'projects_other', 'contr_type',
    'contr_type_other', 'regular', 'how_got_started', 'how_got_started_other',
    'interested', 'limitations'
]
nonnumpy_contributions_dtype = np.dtype({
    "names": column_names,
    "formats": ['<U1024'] * len(column_names),
})

ossdata = np.loadtxt(
    fname, delimiter='\t', skiprows=3, dtype=nonnumpy_contributions_dtype,
    usecols=range(31, 42), comments=None
)
# Load data related to NumPy contributions
column_names = [
    'contributed', 'contr_type', 'contr_type_other', 'regular',
    'how_got_started', 'how_got_started_other', 'motivations',
    'motivations_other', 'continue', 'limitations', 'limitations_other',
    'interested', 'interests', 'interests_other'
]

numpy_contributions_dtype = np.dtype({
    "names": column_names,
    "formats": ['<U1024'] * len(column_names),
})

npdata = np.loadtxt(
    fname, delimiter='\t', skiprows=3, dtype=numpy_contributions_dtype,
    usecols=range(42, 57), comments=None
)
assert npdata.shape[0] == ossdata.shape[0]  # Sanity check on data
# Selection criteria for subsequent analysis
oss_contributors_mask = ossdata['contributed'] == 'Yes'
np_contributors_mask = npdata['contributed'] == 'Yes'
# Compute some basic parameters on OSS/np-specific contributions
num_respondents = npdata.shape[0]
num_oss_contributors = oss_contributors_mask.sum()
num_np_contributors = np_contributors_mask.sum()
num_both_contributors = np.sum(oss_contributors_mask & np_contributors_mask)
# Compute fraction of regular contributors.
num_oss_regular = np.sum(ossdata['regular'][oss_contributors_mask] == 'Yes')
num_np_regular = np.sum(npdata['regular'][np_contributors_mask] == 'Yes')
# Links for report
glue(
    'oss_contributors',
    gluval(num_oss_contributors, num_respondents),
    display=False
)
glue(
    'np_contributors',
    gluval(num_np_contributors, num_respondents),
    display=False
)
glue(
    'numpy_and_oss_contributors',
    gluval(num_both_contributors, num_np_contributors),
    display=False
)
glue(
    'oss_regulars',
    gluval(num_oss_regular, num_oss_contributors),
    display=False
)
glue(
    'np_regulars',
    gluval(num_np_regular, num_np_contributors),
    display=False
)
NumPy & OSS Contributors
Of the 1236 survey participants, 490 (40%) have contributed to at least one open source software project, while 88 (7%) have contributed to NumPy specifically. 174 (36%) of OSS contributors are currently1 regular contributors to at least one OSS project, while 16 (18%) of the NumPy contributors contribute to NumPy regularly. Reflecting its central position in the scientific Python ecosystem, 85 (97%) of NumPy contributors reported contributing to other OSS projects as well.
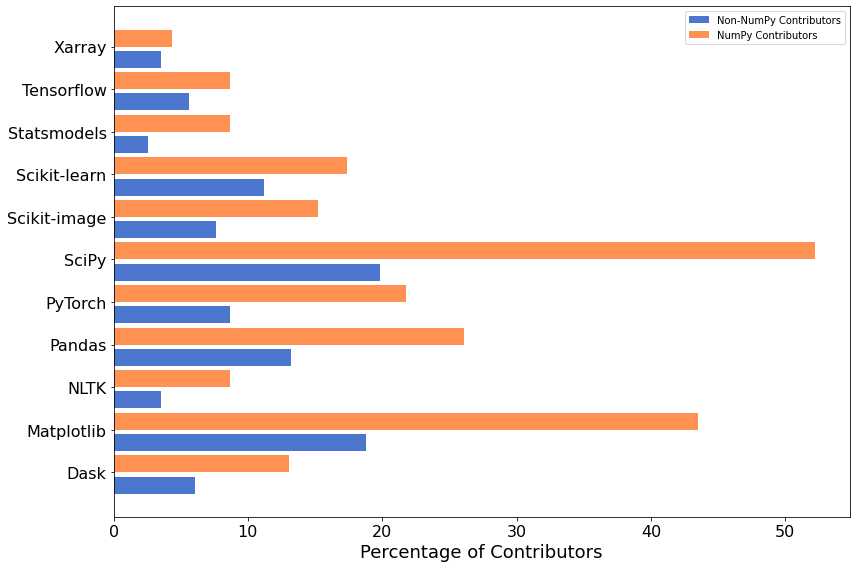
OSS Contributions
The following figure illustrates shows what fraction of contributors are working on various popular scientific Python projects.
# Remove less-popular projects
projects_to_drop = (
    'Gensim', 'spaCy', '',
    'Other (please specify - use commas to separate multiple entries)'
)

fig, ax = plt.subplots(figsize=(12, 8))
for (start_ind, mask, label) in zip(
    (0, 1),
    (oss_contributors_mask, np_contributors_mask),
    ('Non-NumPy Contributors', 'NumPy Contributors')
):
    project_data = flatten(ossdata['projects'][mask])
    labels, cnts = np.unique(project_data, return_counts=True)
    # Projects to drop from all datasets
    for proj in projects_to_drop:
        drop = (labels != proj)
        labels, cnts = labels[drop], cnts[drop]
    # Plot
    ax.barh(
        np.arange(start_ind, 2 * len(labels), 2),
        100 * cnts / mask.sum(),
        align='edge',
        label=label,
    )
ax.set_yticks(np.arange(start_ind, 2 * len(labels), 2))
ax.set_yticklabels(labels)
ax.set_xlabel('Percentage of Contributors')
ax.legend()
fig.tight_layout()
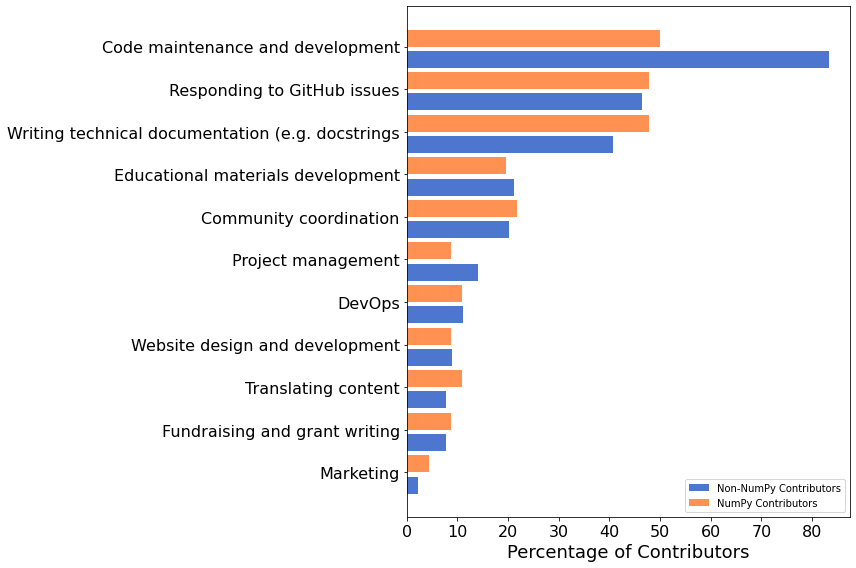
Types of Contributions
We also asked in what ways people are contributing to open-source software projects. 74% of respondents who have contributed to NumPy have contributed to the source code and 48% to the documentation. While 71% of respondents who contribute to other OSS projects have contributed to code, only 36% have pitched in to help with documentation.
oss_contr_type = flatten(ossdata['contr_type'][oss_contributors_mask])
np_contr_type = flatten(npdata['contr_type'][np_contributors_mask])

fig, ax = plt.subplots(2, 1, figsize=(8, 12))
# NOTE: Unfortunately, the categories for the OSS & np contributions aren't
# the same, so direct comparison is more difficult.
# Handle each dataset separately.
labels, cnts = np.unique(np_contr_type, return_counts=True)
# Ignore duplicate categories from bad split
labels, cnts = labels[1:], cnts[1:]
I = np.argsort(cnts)
labels, cnts = labels[I], cnts[I]
ax[0].set_title('NumPy Contributions')
ax[0].barh(np.arange(len(labels)), 100 * cnts / np_contributors_mask.sum(), align='center')
ax[0].set_yticks(np.arange(len(labels)))
ax[0].set_yticklabels(labels)
ax[0].set_xlabel('Percentage of NumPy Contributors')
# Highlight code and docs contributions
code_contr = cnts[labels == 'Programming'][0]
doc_contr = cnts[labels == 'Writing documentation'][0]
glue(
    'pct_contrib_np_code',
    f"{100 * code_contr / np_contributors_mask.sum():2.0f}%",
    display=False,
)
glue(
    'pct_contrib_np_docs',
    f"{100 * doc_contr / np_contributors_mask.sum():2.0f}%",
    display=False,
)


labels, cnts = np.unique(oss_contr_type, return_counts=True)
labels, cnts = labels[3:], cnts[3:]
# TODO: Remove these hacks when categories have been synchronized
labels[3] = 'Developing tutorials'
labels[-1] = 'Writing documentation'
I = np.argsort(cnts)
labels, cnts = labels[I], cnts[I]
ax[1].set_title('Other (non-NumPy) OSS Contributions')
ax[1].barh(np.arange(len(labels)), 100 * cnts / oss_contributors_mask.sum(), align='center')
ax[1].set_yticks(np.arange(len(labels)))
ax[1].set_yticklabels(labels)
ax[1].set_xlabel('Percentage of OSS Contributors')
# Highlight code and docs contributions
code_contr = cnts[labels == 'Code maintenance and development'][0]
doc_contr = cnts[labels == 'Writing documentation'][0]
glue(
    'pct_contrib_oss_code',
    f"{100 * code_contr / oss_contributors_mask.sum():2.0f}%",
    display=False,
)
glue(
    'pct_contrib_oss_docs',
    f"{100 * doc_contr / oss_contributors_mask.sum():2.0f}%",
    display=False,
)

fig.tight_layout()
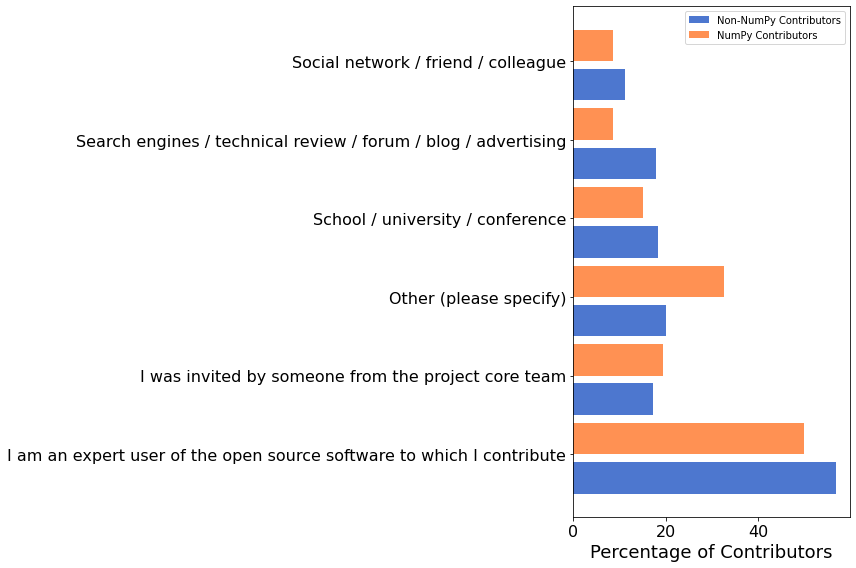
How Did Contributors Get Their Start?
We also asked how contributors got started working on the OSS packages that they contribute to:
fig, ax = plt.subplots(figsize=(12, 8))
for start_ind, (data, mask, label) in enumerate(zip(
    (ossdata, npdata),
    (oss_contributors_mask, np_contributors_mask),
    ('Non-NumPy Contributors', 'NumPy Contributors')
)):
    how_data = data['how_got_started'][mask]
    # Remove non-responses
    how_data = how_data[how_data != '']
    data = flatten(how_data)
    labels, cnts = np.unique(data, return_counts=True)
    # Plot
    ax.barh(
        np.arange(start_ind, 2 * len(labels), 2),
        100 * cnts / len(how_data),
        align='edge',
        label=label,
    )
ax.set_yticks(np.arange(start_ind, 2 * len(labels), 2))
ax.set_yticklabels(labels)
ax.set_xlabel('Percentage of Contributors')
ax.legend()
fig.tight_layout()
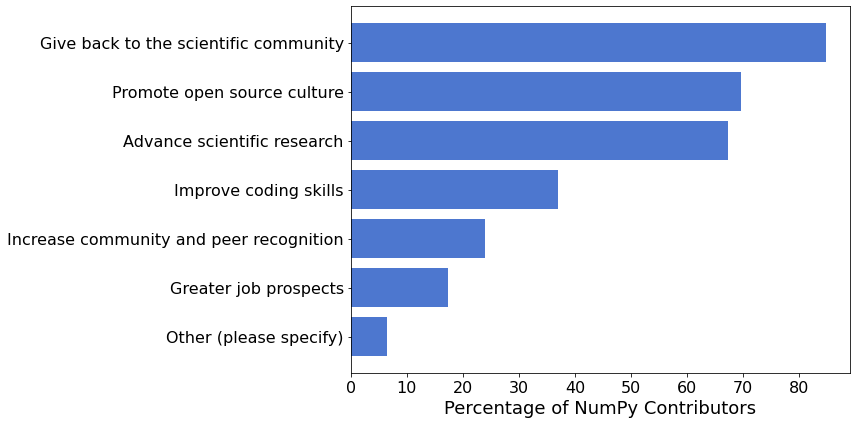
Motivations
Advance scientific research, Promote open source culture, and Give back to the scientific community are the top three reasons for the respondents to contribution to NumPy.
# NumPy data only, no need to apply np/oss masks
motivations = npdata['motivations'][npdata['motivations'] != '']
labels, cnts = np.unique(flatten(motivations), return_counts=True)
I = np.argsort(cnts)
labels, cnts = labels[I], cnts[I]

fig, ax = plt.subplots(figsize=(12, 6))
ax.barh(np.arange(len(labels)), 100 * cnts / len(motivations))
ax.set_yticks(np.arange(len(labels)))
ax.set_yticklabels(labels)
ax.set_xlabel('Percentage of NumPy Contributors')
fig.tight_layout()

# Highlight top 3
glue('top_3_motivations', f"{labels[-3]}, {labels[-2]}, and {labels[-1]}", display=False)
Retention
Finally, we asked NumPy contributors whether they plan to continue to contribute to NumPy. 16 (100%) of survey participants who identified themselves as regular NumPy contributors plan to continue contributing. Of the 72 NumPy contributors who did not consider themselves regular contributors, 81% plan to continue contributing.
np_regular_mask = npdata['regular'] == 'Yes'
regular_continue = npdata['continue'][np_regular_mask] == 'Yes'
glue(
    'regular_continue_pct',
    gluval(regular_continue.sum(), np_regular_mask.sum()),
    display=False
)
non_regular_contributor_mask = (np_contributors_mask) & (~np_regular_mask)
glue(
    'num_nonregular_np_contributors',
    non_regular_contributor_mask.sum(),
    display=False
)
num_nonregular_continue = np.sum(
    npdata['continue'][non_regular_contributor_mask] == 'Yes'
)
glue(
    'become_regular_pct',
    f'{100 * num_nonregular_continue / non_regular_contributor_mask.sum():1.0f}%',
    display=False
)
Users Who Haven’t (Yet) Contributed
We also wanted to get the perspective of NumPy (and other OSS) users who have not directly contributed back to project — is there generally interest in doing so? What are the biggest stumbling blocks for users who want to contribute back? Of the 1236 survey respondents, 547 (44%) report never having contributed to an OSS project and 920 (74%) report never having contributed to NumPy specifically.
num_oss_non_contributors = np.sum(ossdata['contributed'] == 'No')
num_np_non_contributors = np.sum(npdata['contributed'] == 'No')
glue(
    'oss_non_contributors',
    gluval(num_oss_non_contributors, num_respondents),
    display=False
)
glue(
    'np_non_contributors',
    gluval(num_np_non_contributors, num_respondents),
    display=False
)
Interest in Contributing
We asked these respondents whether they were interested in contributing to the OSS packages that they use. 453 (83%) said they were interested in contributing to OSS generally, and 627 (68%) to NumPy specifically.
oss_interested_mask = (ossdata['contributed'] == 'No') & (ossdata['interested'] == 'Yes')
np_interested_mask = (npdata['contributed'] == 'No') & (npdata['interested'] == 'Yes')
glue(
    'oss_interested',
    gluval(oss_interested_mask.sum(), num_oss_non_contributors),
    display=False
)
glue(
    'np_interested',
    gluval(np_interested_mask.sum(), num_np_non_contributors),
    display=False
)
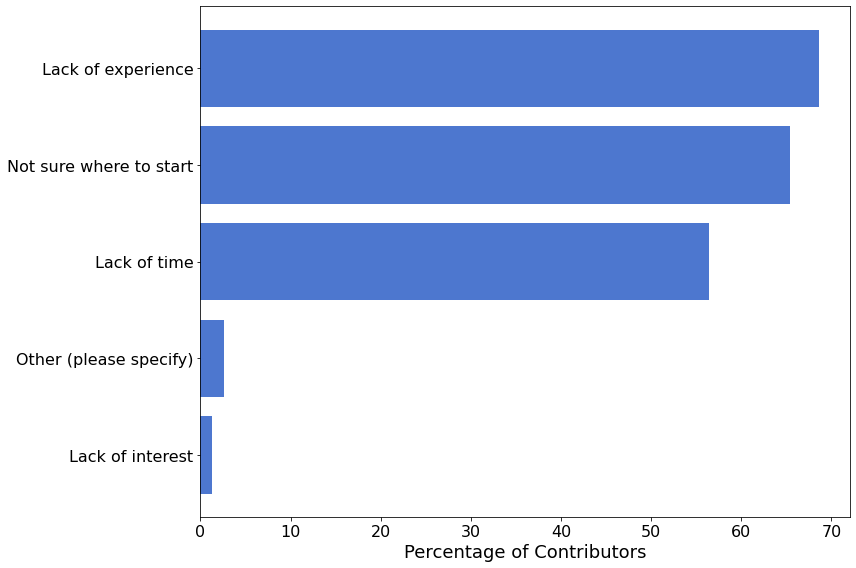
Contribution Blockers
We also asked respondents who expressed interest in contributing about the biggest blockers that prevent them from doing so.
fig, ax = plt.subplots(figsize=(12, 8))
limitations = ossdata['limitations'][oss_interested_mask]
# Remove non-responses
limitations = limitations[limitations != '']
data = flatten(limitations)
labels, cnts = np.unique(data, return_counts=True)
I = np.argsort(cnts)
labels, cnts = labels[I], cnts[I]
# Plot
ax.barh(np.arange(len(labels)), 100 * cnts / len(limitations))
ax.set_yticks(np.arange(len(labels)))
ax.set_yticklabels(labels)
ax.set_xlabel('Percentage of Contributors')
fig.tight_layout()
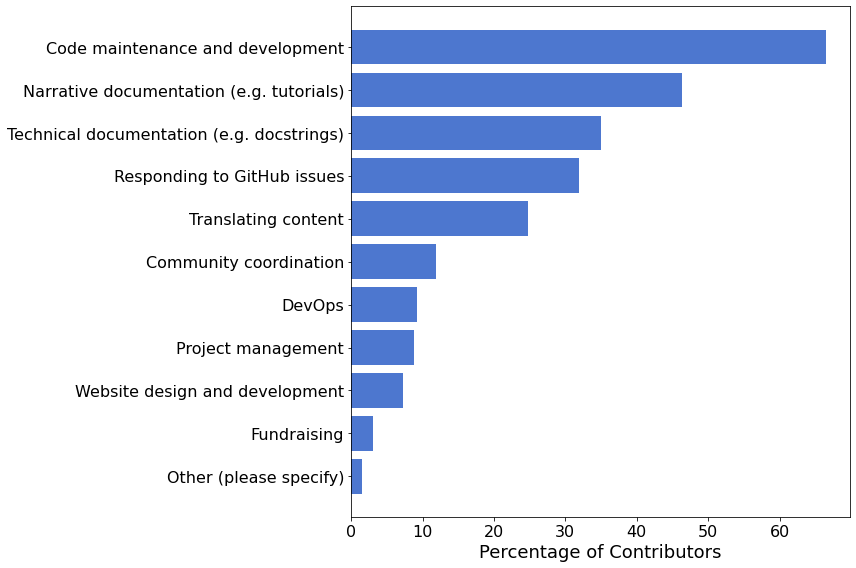
Interests of Potential Contributors
Of the respondents who expressed interest in contributing to NumPy, most (75%) were interested in contributing to the source code. The next most popular category was contributing to the documentation, with 382 (63%) respondents expressing an interest. 192 (32%) people were interested in contributing to both narrative documentation (e.g. tutorials) and technical documentation (e.g. reference guides), while 105 (17%) were interested only in narrative documentation, and 85 (14%) only in technical documentation.
interests = npdata['interests'][np_interested_mask]
interests = interests[interests != '']
data = flatten(interests)
labels, cnts = np.unique(data, return_counts=True)
# TODO: Remove these hacks when categories have been synchronized
labels, cnts = labels[2:], cnts[2:]
labels[3] = 'Narrative documentation (e.g. tutorials)'
labels[-1] = 'Technical documentation (e.g. docstrings)'
I = np.argsort(cnts)
labels, cnts = labels[I], cnts[I]


fig, ax = plt.subplots(figsize=(12, 8))
ax.barh(np.arange(len(labels)), 100 * cnts / len(interests))
ax.set_yticks(np.arange(len(labels)))
ax.set_yticklabels(labels)
ax.set_xlabel('Percentage of Contributors')
fig.tight_layout()

# Highlight top categories
glue('pct_want_contrib_code', f"{100 * cnts[-1] / interests.shape[0]:2.0f}%", display=False)

# Analyze documentation categories based on individual responses
narr_doc_text = "Developing educational content & narrative documentation (e.g. tutorials)"
tech_doc_text = "Writing technical documentation (e.g. docstrings, user guide, reference guide)"
tech_doc_respondents_mask = np.array(
    [tech_doc_text in response for response in interests], dtype=bool
)
narr_doc_respondents_mask = np.array(
    [narr_doc_text in response for response in interests], dtype=bool
)
num_both = np.sum(
    tech_doc_respondents_mask & narr_doc_respondents_mask
)
num_either = np.sum(
    tech_doc_respondents_mask | narr_doc_respondents_mask
)
num_narr_only = np.sum(
    narr_doc_respondents_mask & ~tech_doc_respondents_mask
)
num_tech_only = np.sum(
    tech_doc_respondents_mask & ~narr_doc_respondents_mask
)

glue(
    'interested_in_both_doc_types',
    gluval(num_both, interests.shape[0]),
    display=False,
)
glue(
    'interested_in_either_doc_type',
    gluval(num_either, interests.shape[0]),
    display=False,
)
glue(
    'interested_in_narr_doc_only',
    gluval(num_narr_only, interests.shape[0]),
    display=False,
)
glue(
    'interested_in_tech_doc_only',
    gluval(num_tech_only, interests.shape[0]),
    display=False,
)
- 1
i.e. regularly contributing at the time of the survey. This does not include contributors who have contributed regularly to projects in the past.